We all know and love Microsoft’s AppCenter offering when it comes to analytics and crash reporting for our mobile apps. But what if you’re one of those people that are interested in even more in-depth usage statistics? Let’s take a look at Firebase Analytics to satisfy our need for statistics!
I’ve done posts about analytics before, but they’re pretty outdated at this point. Since this post is one of the bigger ones on here, I will add an index allowing you to quickly jump to the section you need.
- Introducing Firebase
- Filling the Firebase prerequisites
- Creating the shared code
- Setting up the Android app
- Setting up the iOS app
- Debugging your Firebase analytics
- Additional things you need to know
Introducing Firebase
If you’ve ever developed an app for Android you probably have seen this name pop up once or twice. Firebase is Google’s mobile platform that helps developers with all sorts of support features which range from sending push notifications to analytics or performance monitoring. When it comes to analytics tracking it also Google’s suggested approach for mobile apps since using the Google Analytics UA code for mobile apps is slowly being phased out.
Filling the Firebase prerequisites
For our mobile app to gather statistics we will first need to register it with Google. We do this by going to the Firebase console and logging in with our Google account. The app we’ll be tracking is known as a project, so to make one we hit the Create project button.
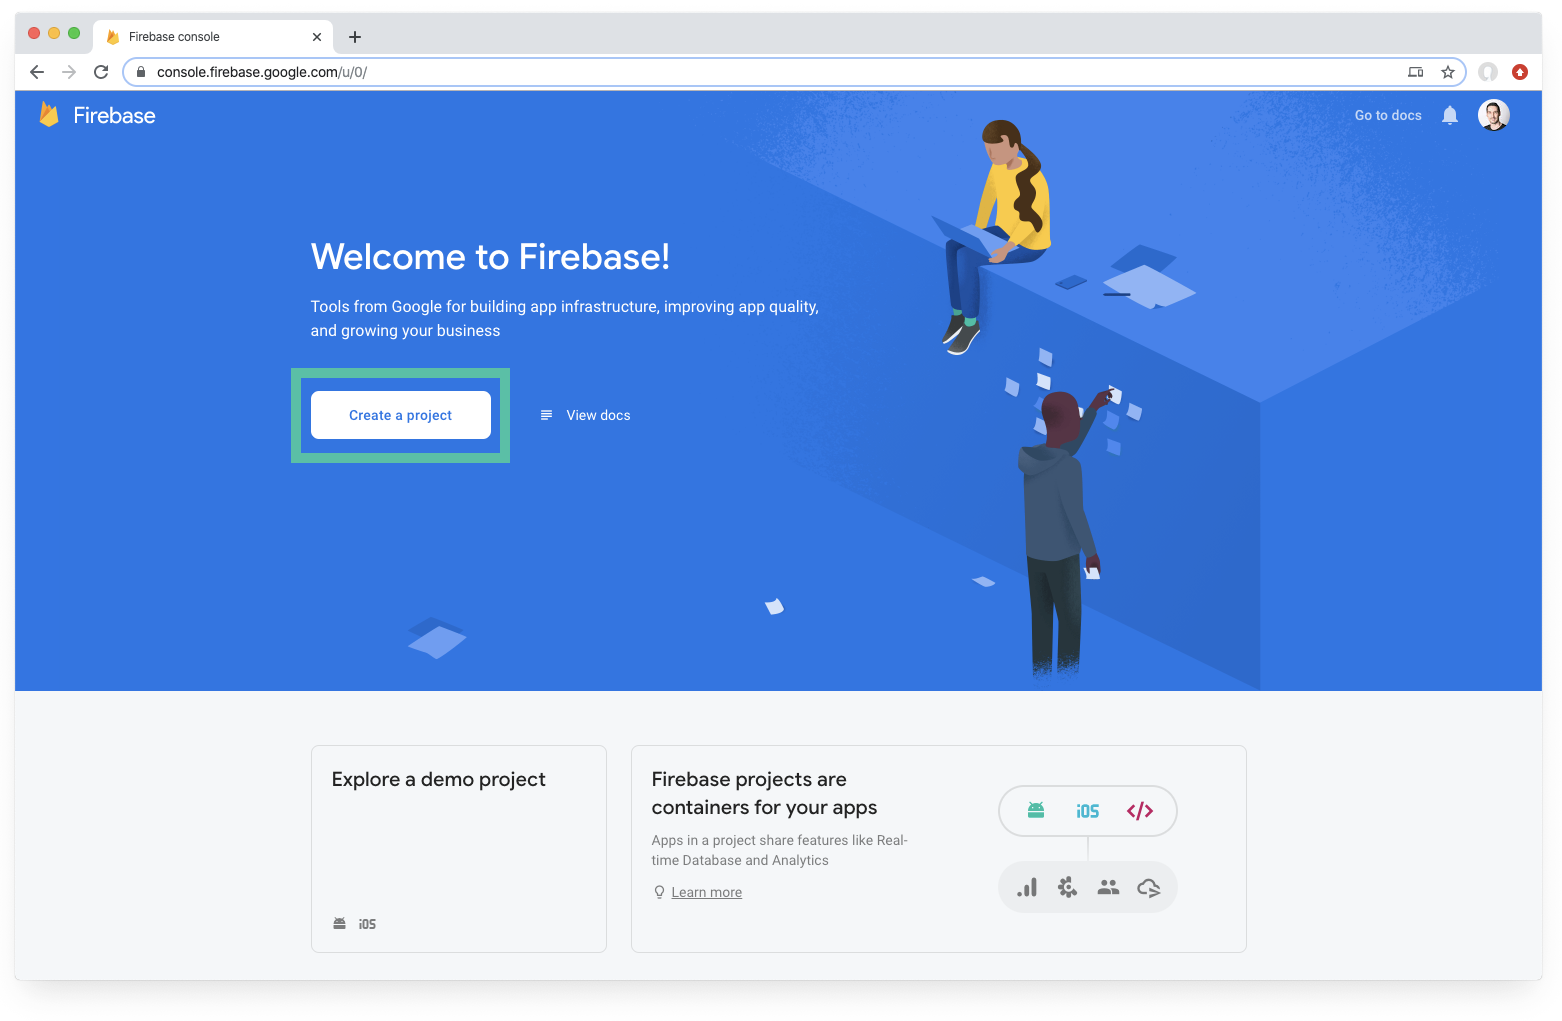 Adding a project is simple, simply click the button!
When creating the project we need to provide a name so provide it with one. I went for MyLittleProject. They don’t ask for much else, so it should be fairly straightforward from here on out. Do ensure that you are also enabling Google Analytics for this project. The toggle should be enabled by default, so just leave it on. Clicking Continue will allow you to pick or create a Google Analytics account so do that as well. Wait while everything is being set up for you and you should end up in the project overview.
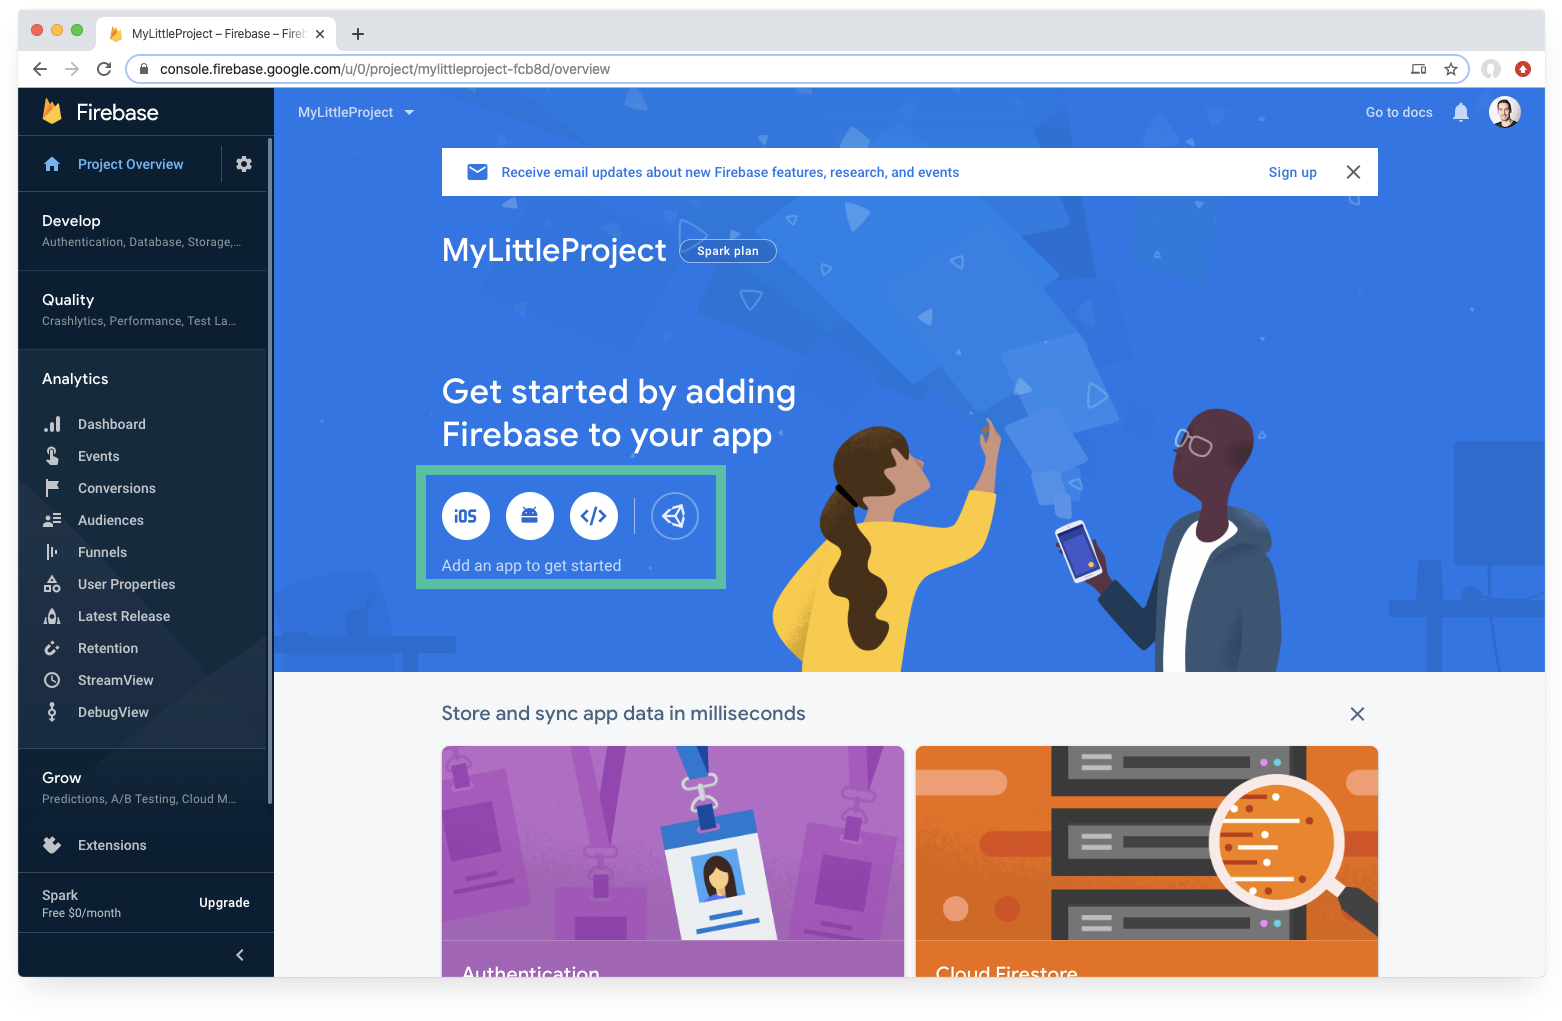 The overview of the project we just created.
This page already tells you what to do next, we need to create an iOS and/or Android app. To do so, click one of the buttons as shown in the screenshot above. After filling in some of the details such as our app name and identifier Google will start provisioning and configuring a Google Cloud project for you. When that’s done you will be able to download a google-services.json file or a GoogleService-Info.plist file (depending on the platform) which we will need later on. Save it somewhere where you can find it later! The other steps in this wizard can be ignored as we will tackle those later as well.
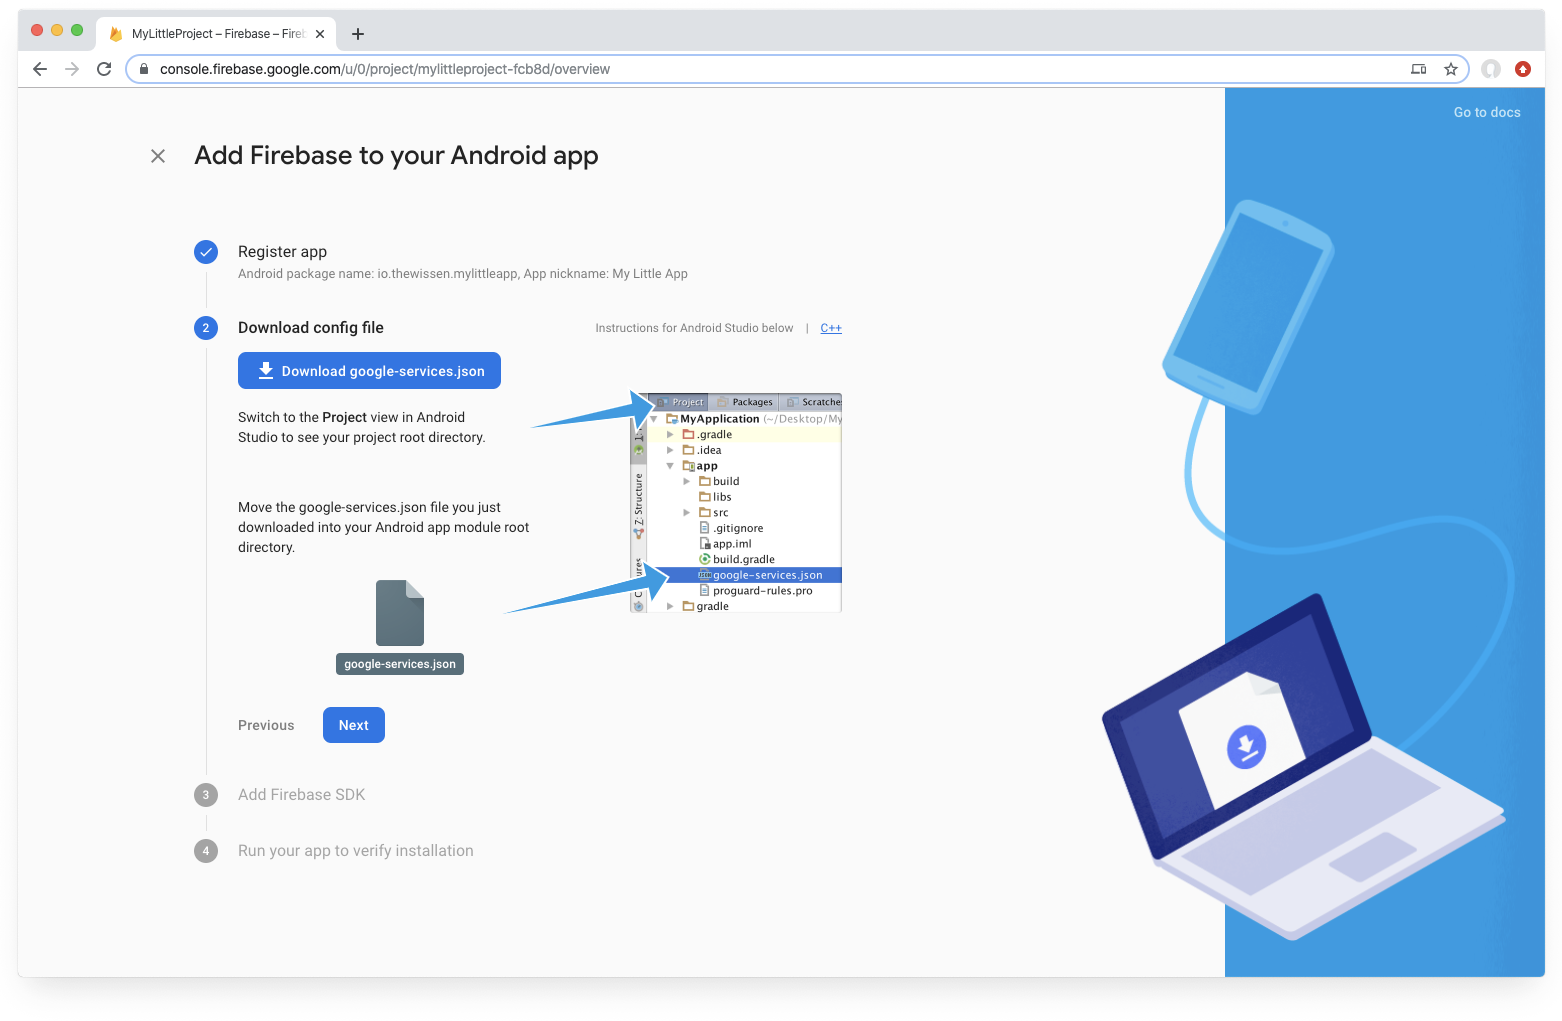 Downloading google-services.json is crucial here!
With our prerequisites out of the way, we will continue by creating an interface in our shared project that will represent the actions we want to be able to perform. It can be rather simple since initially, we will only want to log events. I added a method to identify the user as well, which makes us able to easily track the user journey through our app.
With the interface in place, we can also start implementing this in our pages and/or page models. By using dependency injection or the built-in dependency service we can get an instance of this interface and call all the methods on it. I won’t go into detail on how that works since there is more than enough documentation on that topic.
Setting up the Android app
To get up and running on Android we first need to install a few NuGet packages. We will use Plugin.CurrentActivity to easily get the current app’s context, so make sure you follow the setup for it as described on its GitHub.
Then, make sure to add the INTERNET permission in the Android manifest file. Also, add the google-services.json file that we downloaded earlier and put it in the root directory of the Android app. To tell the platform that this is a special kind of file we also need to set the build action to GoogleServicesJson.
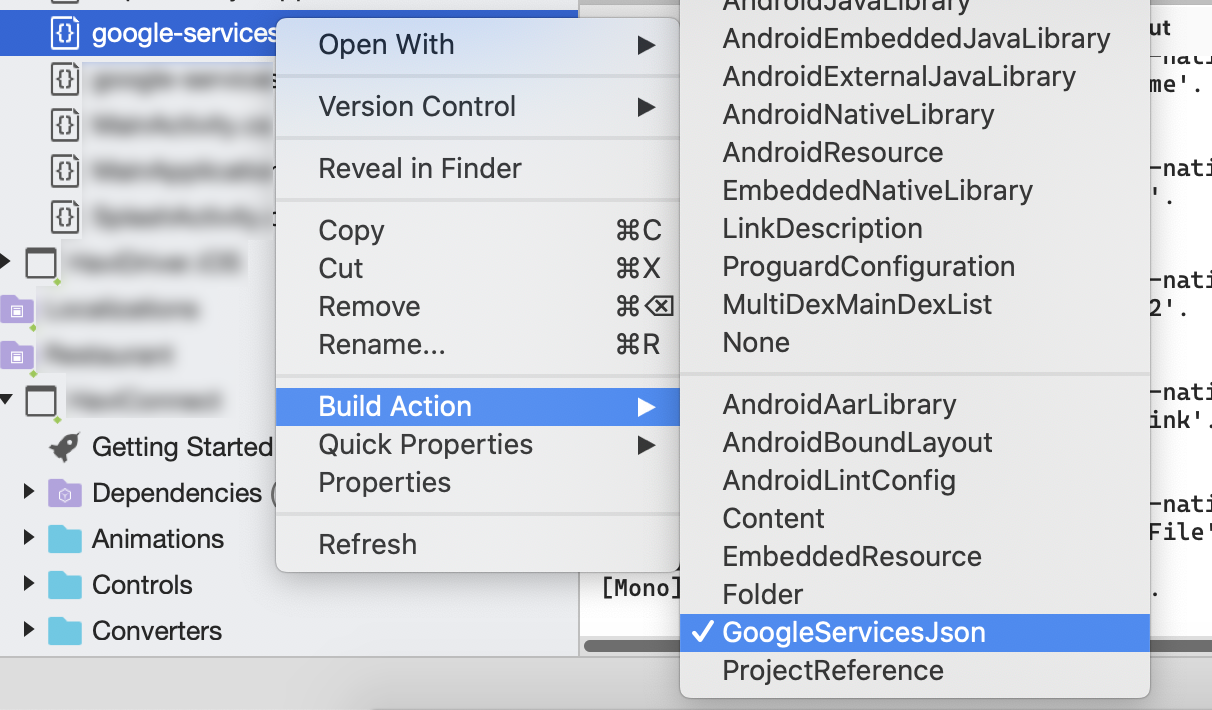 Set the build action for the google-services.json file.
Now that we’ve done all the plumbing on the Android side we can start writing some more code. We need to build our Android-specific implementation for IFirebaseAnalyticsService, which looks like this:
As you can tell, I’ve wrapped most methods in a DEBUG compiler directive to ensure that they don’t run when I’m debugging. We don’t want our developing efforts to interfere with the actual analytics we’re gathering in production. Other than that it mainly consists of wrapping methods from the NuGet packages we referenced and passing in the parameters we receive. We can also provide additional parameters to the LogEvent call to provide metadata to it.
Setting up the iOS app
Next up is our iOS app, for which we will also start by installing the necessary NuGet package. Yes, it’s just the one :)
This is the point where we add the GoogleService-Info.plist file we downloaded earlier to the project. Ensure the build action is set to BundleResource so iOS knows what to do with it. Since this post is all about analytics it might be worth opening it up quickly and checking whether or not the IS_ANALYTICS_ENABLED is set to true to prevent any errors from occurring later.
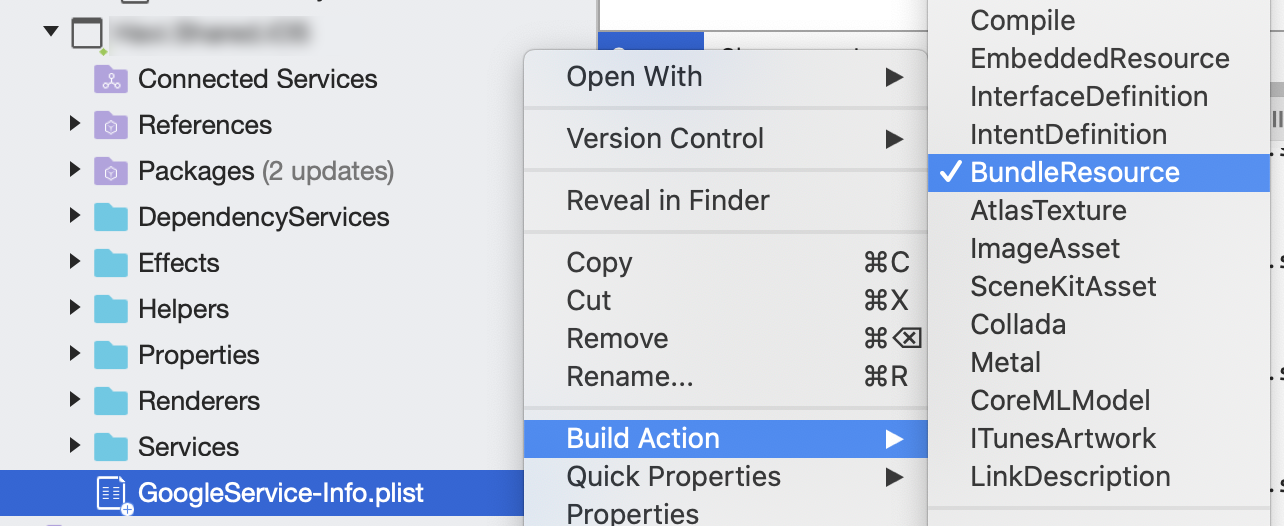 *Set the build action to BundleResource.*
One small additional step that we need to do to set up Firebase on iOS is to initialize it. We do this by adding a line of code to our AppDelegate.cs file. Make sure the line is added before the call to base.FinishedLaunching and you should be good to go.
Next up is adding our iOS-specific implementation of the IFirebaseAnalyticsService interface. It’s fairly similar to the one we did for Android with only minor differences to the methods we call and their parameters.
And that’s it! Now it’s time to put calls to the LogEvent method wherever you want to track something and you should be able to see your events slowly start dripping into Firebase Analytics. One way to check is by using the StreamView which gives a (semi-)live view of what’s happening. However, in the next section, we will also take a look at DebugView which is optimized for debugging.
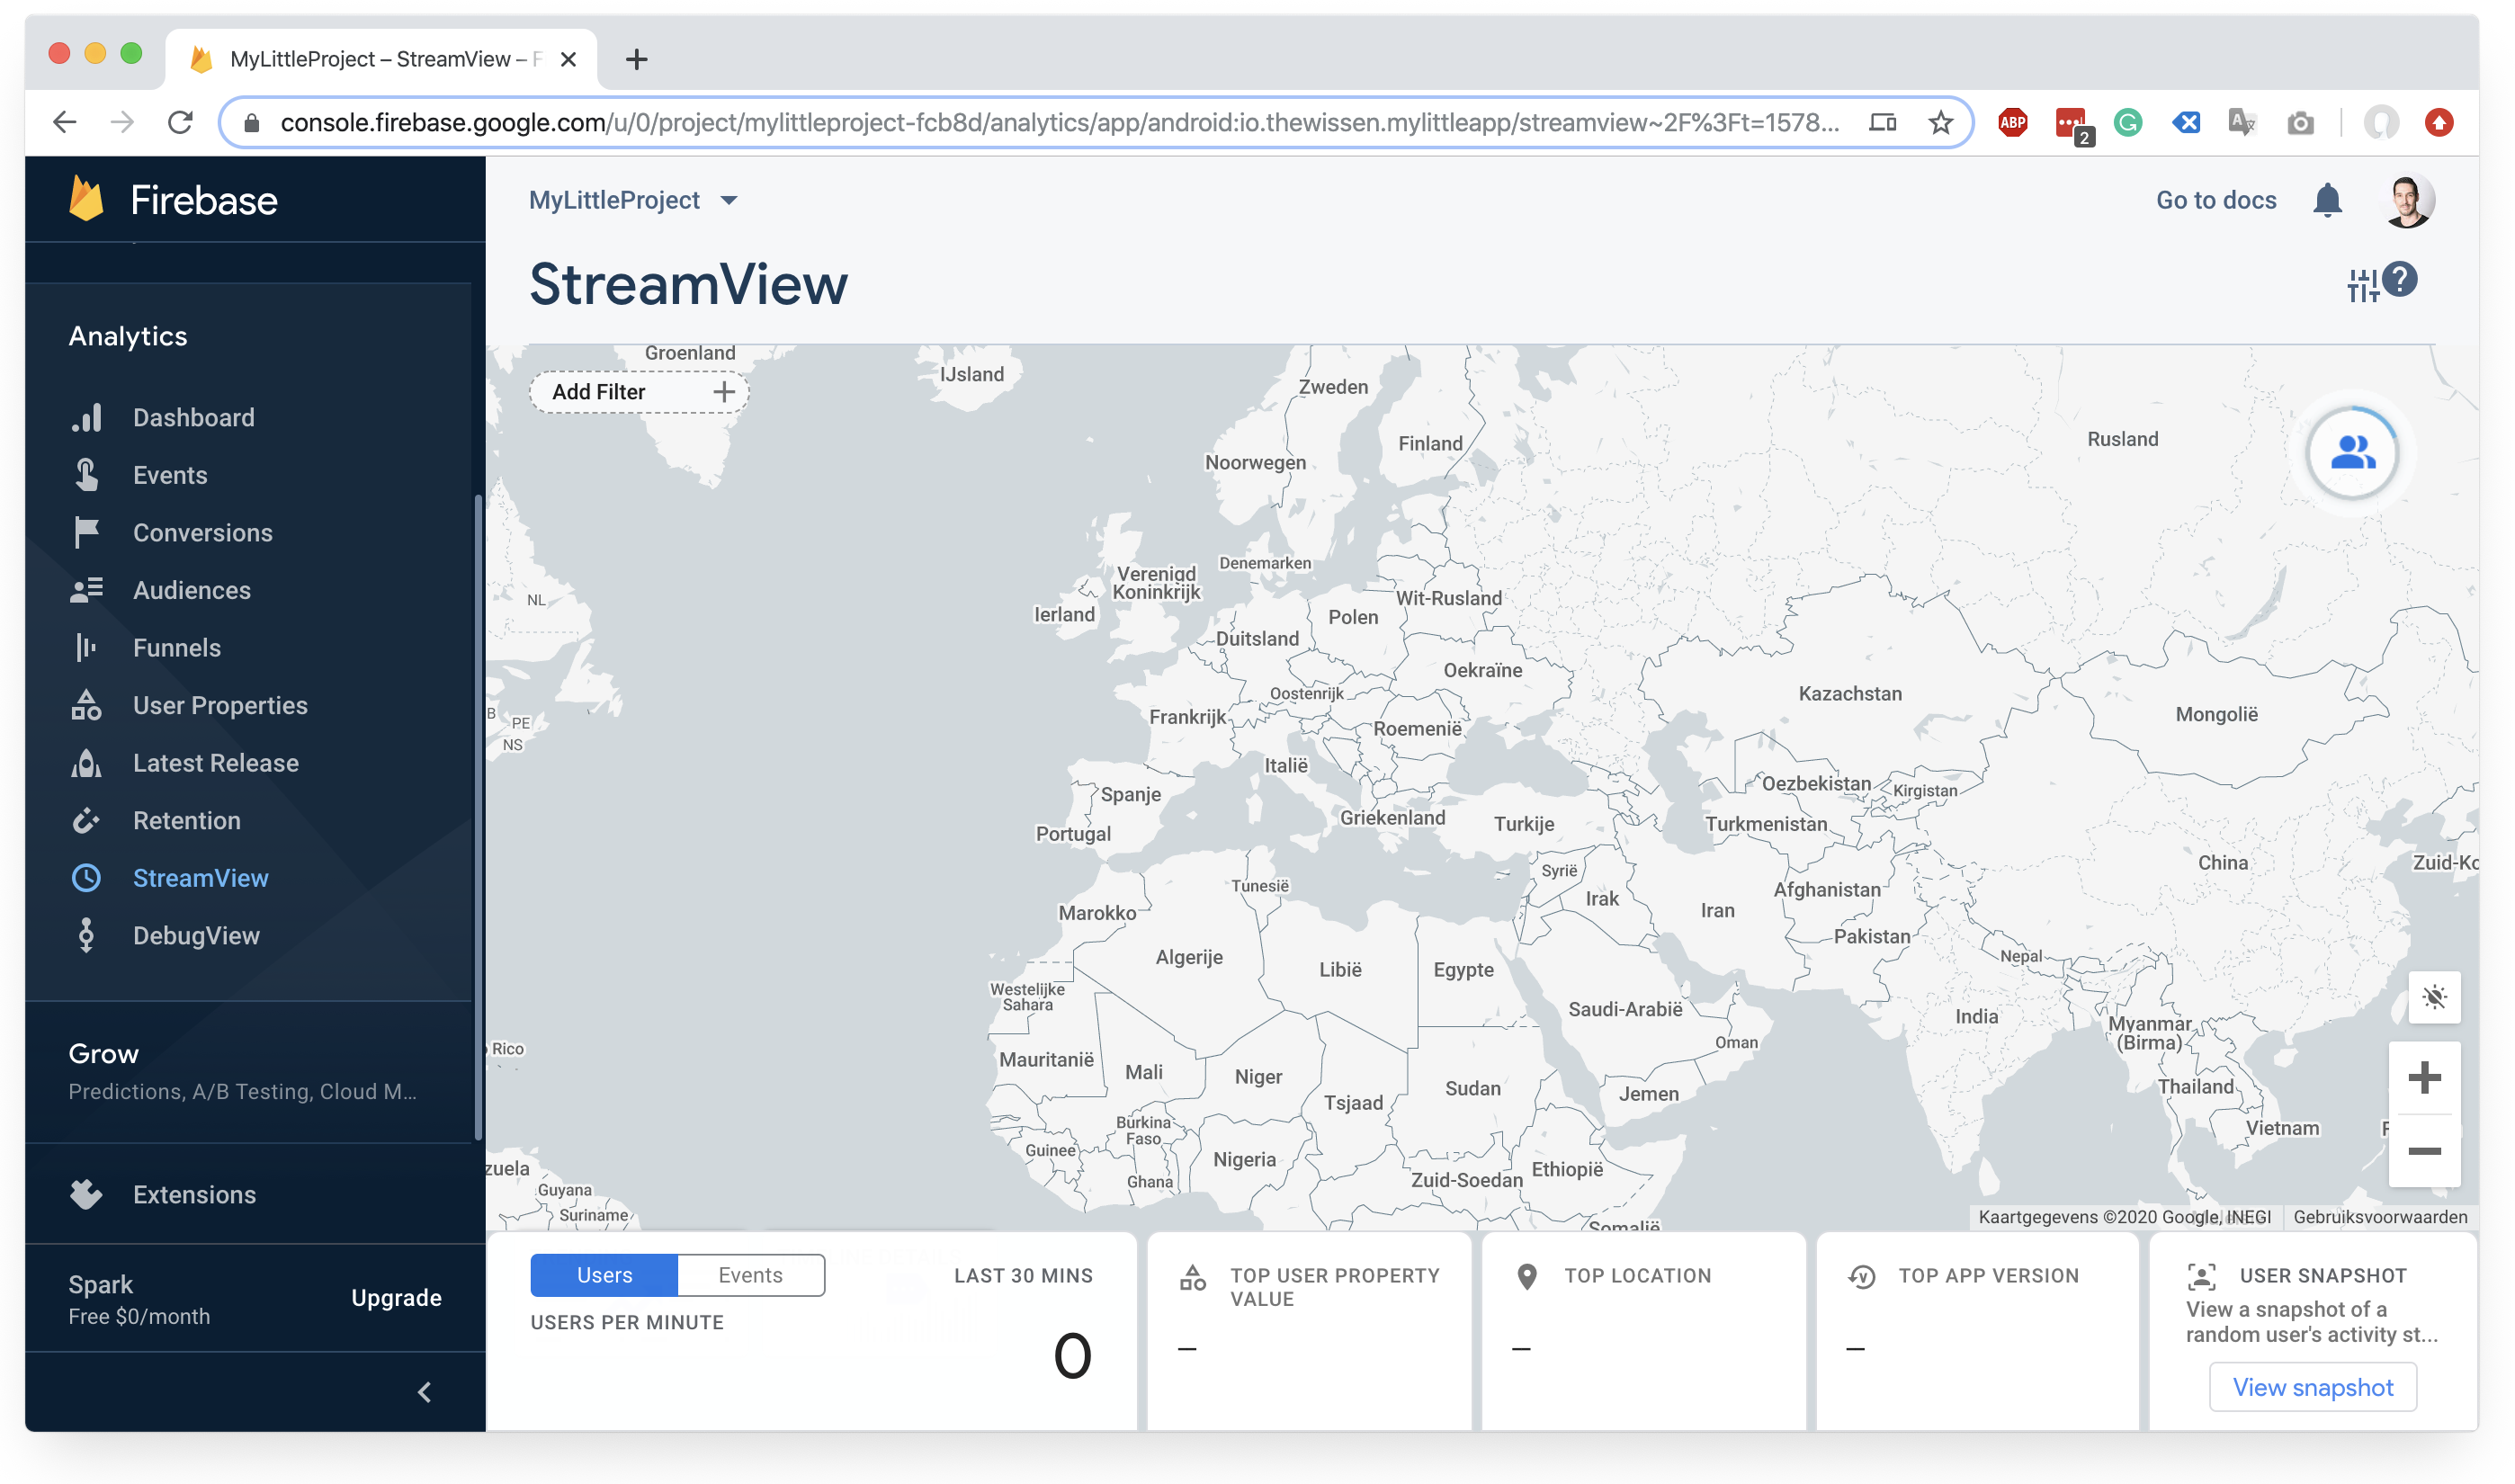 Using the StreamView to see what is currently happening in your app.
Update: Dylan Berry shared a small piece of info with me regarding additional steps for iOS to get it all running. Check these out if you’re running into issues!
I have one piece of advice to add, when debugging in iOS, under Project Options > Run > Configurations > Default, set arguments to “-smth” and extra mlaunch arguments to “—argument=-FIRAnalyticsDebugEnabled” Dylan Berry (@dylbot9000) February 16, 2020
Debugging your Firebase analytics
When sending custom events, which is what you will probably start doing, you need to take into account that it might take a while for them to show. Google informs you of this on the Dashboard page by stating that you will see the first reports within 24 hours.

Who’s got time for that? Therefore Google offers a DebugView which has no such delay and is ideal for quickly testing whether or not your setup is actually working. To set it up you will need to do some work though.
Setting up debugging on Android
This involves using the ADB console, which you can find in your Visual Studio for Mac under Tools > SDK Command Prompt. On Windows it should reside under Tools > Android > Android ADB Command Prompt. Put in the following commands to either enable or disable the DebugView:
- Enable:
adb shell setprop debug.firebase.analytics.app - Disable:
adb shell setprop debug.firebase.analytics.app .none.
When you run your app in debug mode, you should now see the events start coming in when you look at the DebugView on the Firebase console website. Don’t forget to remove the DEBUG compiler directives when you do this though!
If it still doesn’t work, we can gather verbose logging to see what’s going on by executing the following commands in the ADB. You can leave this terminal window open after running the final command and you should see events pop up in it while navigating your app.
Setting up debugging on iOS
First off, you need to make sure you’re testing this on a physical device as the emulators no longer support it. To start using the DebugView on iOS you will need to provide an additional mtouch build argument in your iOS project. Go to its properties and add the following to enable/disable the DebugView:
- Enable:
--argument=-FIRDebugEnabled - Disable:
--argument=-FIRDebugDisabled
When you’ve set it up it should look something like this:
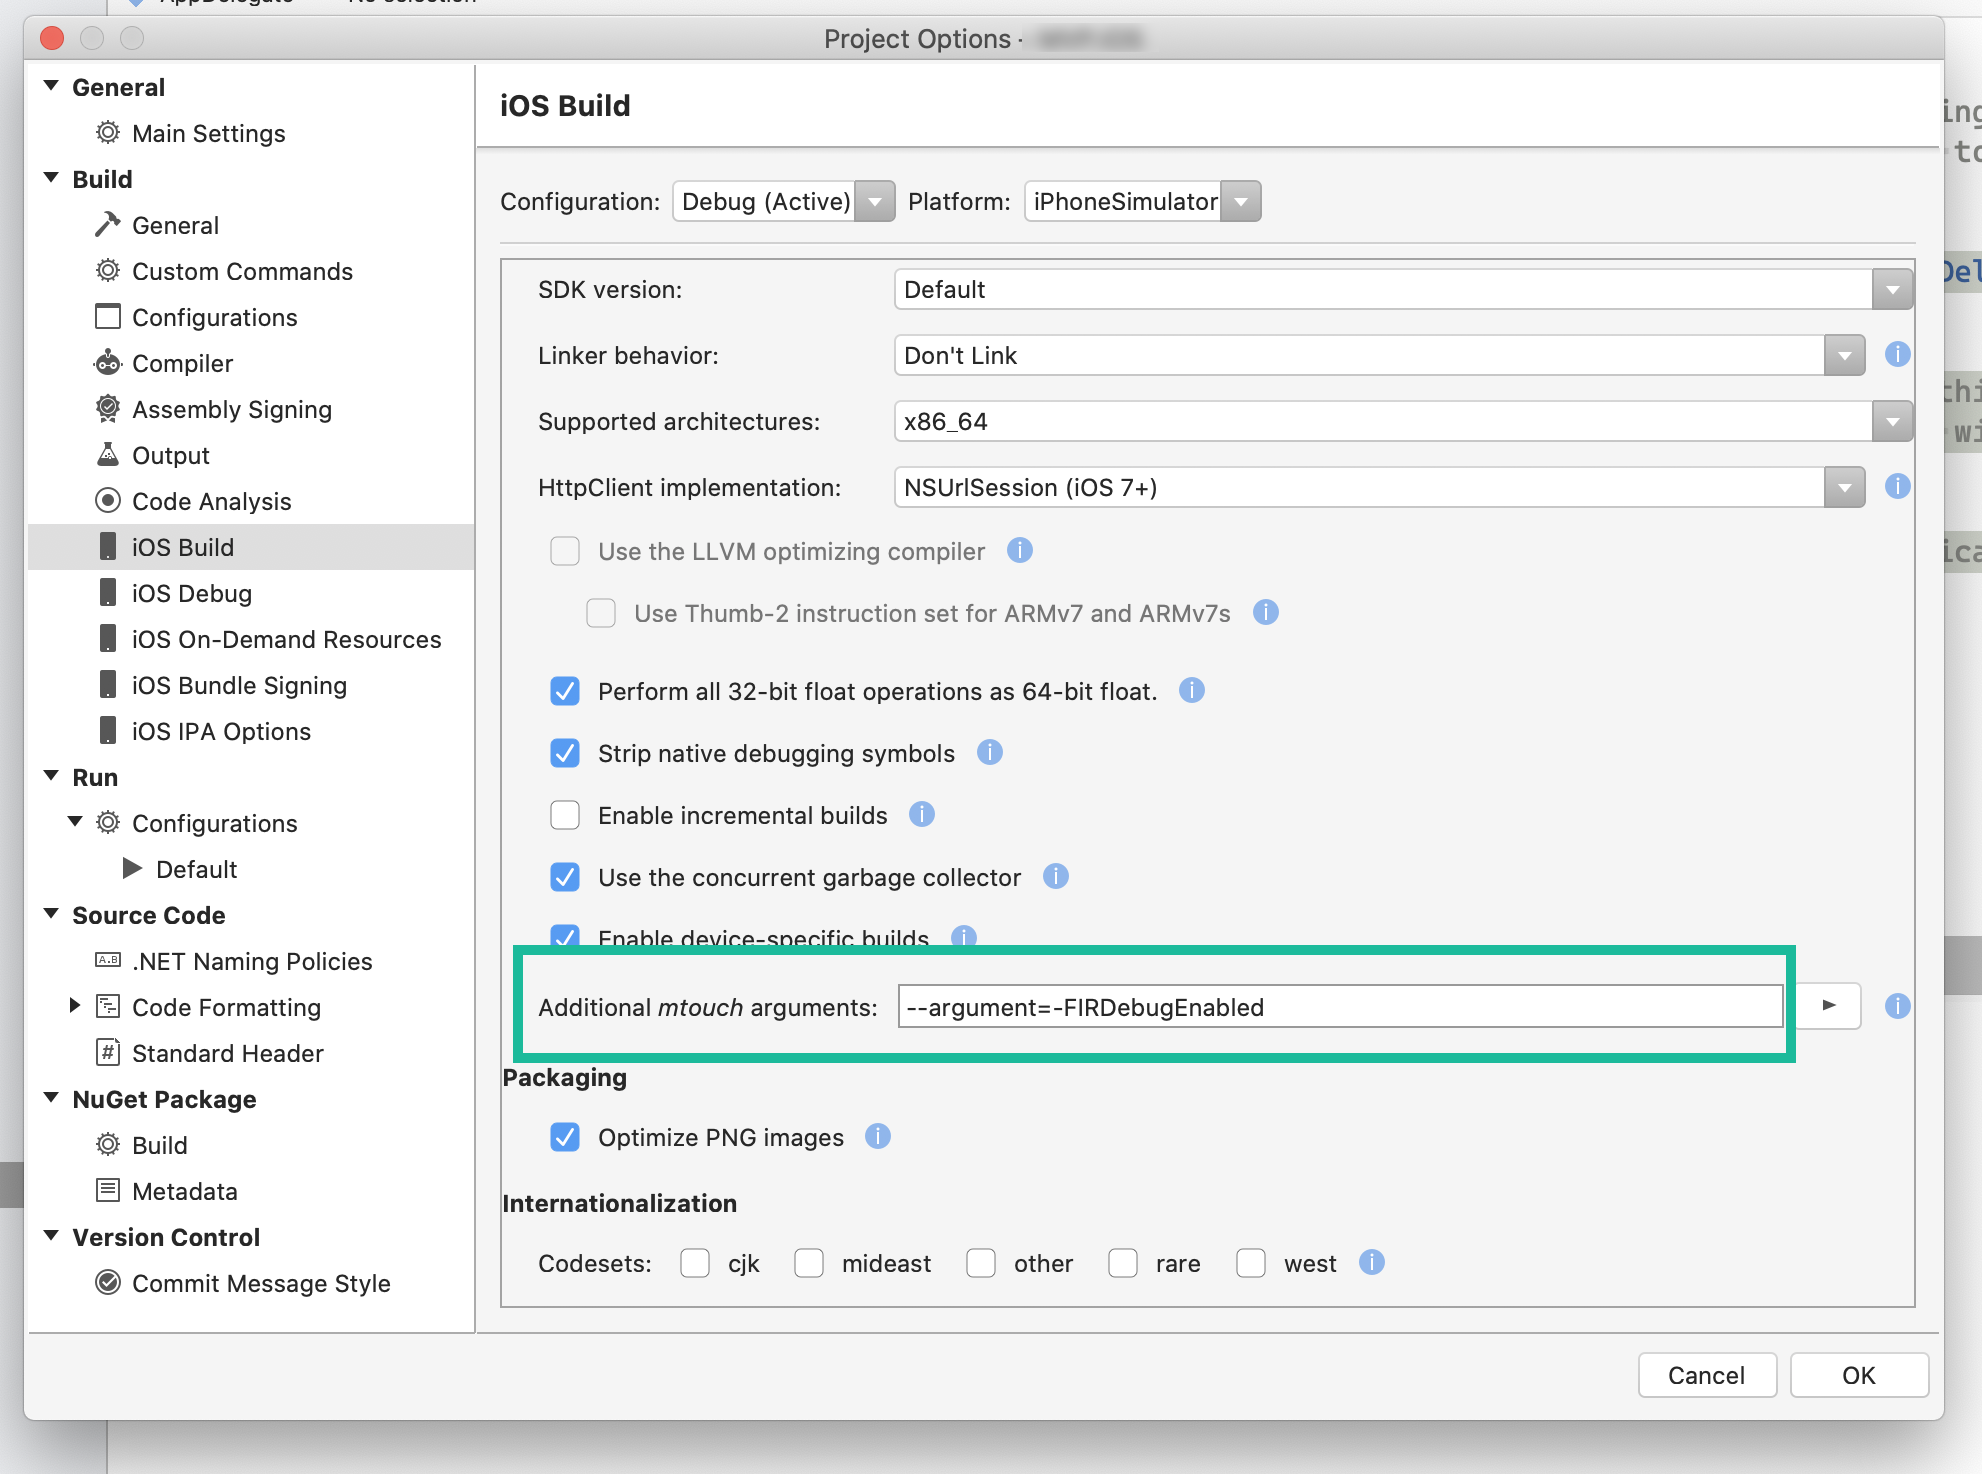 Adding DebugView to your iOS project.
Additional things you need to know about
In closing, there are a few additional things we need to talk about or common problems you may encounter. I will quickly go over a few of them that I encountered, so you don’t have to go through the same issues as I have.
Other tools might’ve disabled analytics tracking
Some tools like Microsoft AppCenter already includes Firebase but forcefully disable analytics tracking. You need to actively re-enable it by adding the following line to your AndroidManifest.xml file within the tag:
Missing google_app_id. Firebase Analytics disabled.
You probably have included the google-services.json file into your Android project, but the NuGet package is looking for an additional piece of information in the Strings.xml file in your Android resources. To fix this, add the following line to your Strings.xml file:
You can find this ID in your google-services.json file, in which it is named mobilesdk_app_id.
 Finding the missing app ID in google-services.json.
Event ID restrictions
The last thing worth noting is that Google puts some restrictions on the ID of the custom events you’re sending over. Here are just a few of the most important ones, but I’m sure I’ll be missing some:
- A maximum of 500 custom events.
- Up to 25 custom event parameters per custom event.
- Up to 50 custom event parameters per project, of which only 40 can be numeric and only 10 can be textual.
- Parameter names can be up to 40 characters long, alphanumeric, with underscores.
- Parameter names must start with an alphabetic character.
- You shouldn’t use the reserved prefixes “firebase”, “google_” and “ga_” as a parameter name.
- Parameter text values can be up to 100 characters long.
So yeah, there are definitely some restrictions in place here. Nevertheless, I hope this read was helpful for you and you can now start tracking your analytics using Firebase!

