When using Entity Framework (or any other ORM for that matter) you always have to be aware of the queries you send to the database. When using a feature like lazy loading it’s fairly easy to create an N+1 query problem which makes you send more queries to the database than you should. MiniProfiler could help you out in this situation.
But what is MiniProfiler? Well what it does is that it attaches itself to raw ADO.NET calls like the ones coming from EF, Linq-To-SQL and many other things. There’s also support for profiling NoSQL databases such as RavenDb or MongoDb. But how does it work? The following MVC with EF sample is taken from one my pet projects and starts off with the following piece of code in my _Layout.cshtml file:
    @using StackExchange.Profiling;
    ...
    ...
    @MiniProfiler.RenderIncludes()
The line just before the closing body tag basically enables MiniProfiler to render itself into your MVC pages. That way you can view the profiling information straight from the page you’re currently visiting. When that page is performing poorly or when MiniProfiler encounters an N+1 query problem it will let you know straight away thanks to that line. It does however need some more initialization code in this case inside the Global.asax file:
using StackExchange.Profiling;
    ...
    protected void Application_BeginRequest()
    {
        if (Request.IsLocal)
        {
            MiniProfiler.Start();
            // Initialize EF logging as well.
            MiniProfilerEF6.Initialize();
        }
    }

    protected void Application_EndRequest()
    {
        MiniProfiler.Stop();
    }
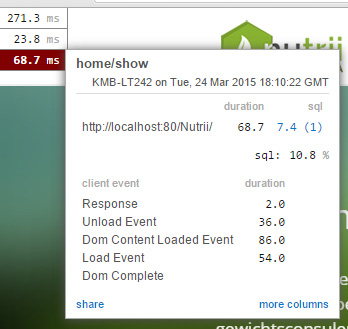
This is a default configuration where you simply start and stop profiling at the beginning and at the end of each request. You have the ability to profile a specific piece of code by using its built in Step() function in a using block, which means that you can make this as granular or high-level as you like. Let’s keep it high level for the sake of this post. So when you’ve configured this, what do you get? Basically what MiniProfiler gives you is a small counter in the top-left corner of your webpage which tells you the time it took to load the page. When you click on it, you get some extra info about how that loadtime is distributed between all the different parts of the page.
 A quick profile of the home page on my pet project.
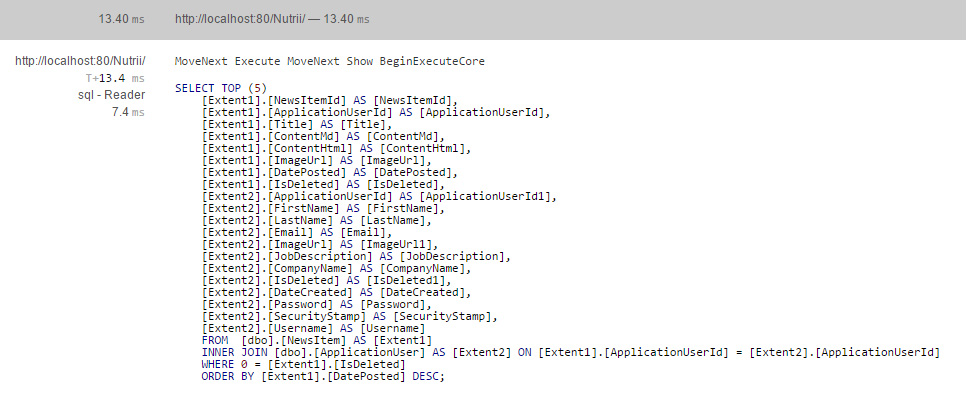
In this sample you can see that the actual controller action took up 68.7ms to load. The 23.8ms entry is a Facebook “Like” button that is on the page and the 271.3ms entry is a Twitter feed on the page. You can also see that this controller has one SQL query which it completed in 7.4ms. When you click on that you can even see what query is being sent to the database, meaning you can easily spot possible performance improvements where you’re either selecting too many columns or firing off too many queries.
 The query being fired that took us 7.4ms.
As you can see EF is retrieving the top 5 news items and also retrieving all the information of the user who posted the news item. I could make some small performance improvements here by not selecting all the columns but only selecting what I need and projecting that into a new object. MiniProfiler makes it easy to spot this kind of thing while still remaining simple and fast to use.

