Want to get rich quickly? Want to earn money while you sleep? Even though it sounds amazing these are the kind of things you can achieve simply by building a cryptocurrency trading bot which you can host in Azure!
Ok, I admit. That intro was a bit overzealous. There is absolutely no guarantee that what we’ll be creating in this post is going to make you any money whatsoever. Surely you can use it to actually automate trading on the cryptocurrency market but this software was primarily created for educational purposes only. Don’t risk money which you are afraid to lose. What you do with this piece of software is your own responsibility.
Getting started with Azure Functions
I’ve talked about Azure Functions before but for those of you that don’t know what they are; an Azure Function is a piece of code that can be run independently in the cloud. It scales automatically depending on how much it gets called and can have a lot of different triggers. You can use an HTTP trigger which makes a function trigger when you do a GET request to a specific endpoint or a timer trigger to periodically run a piece of code. There’s a lot of flexibility in these functions and they are very useful in creating a cloud-based architecture.
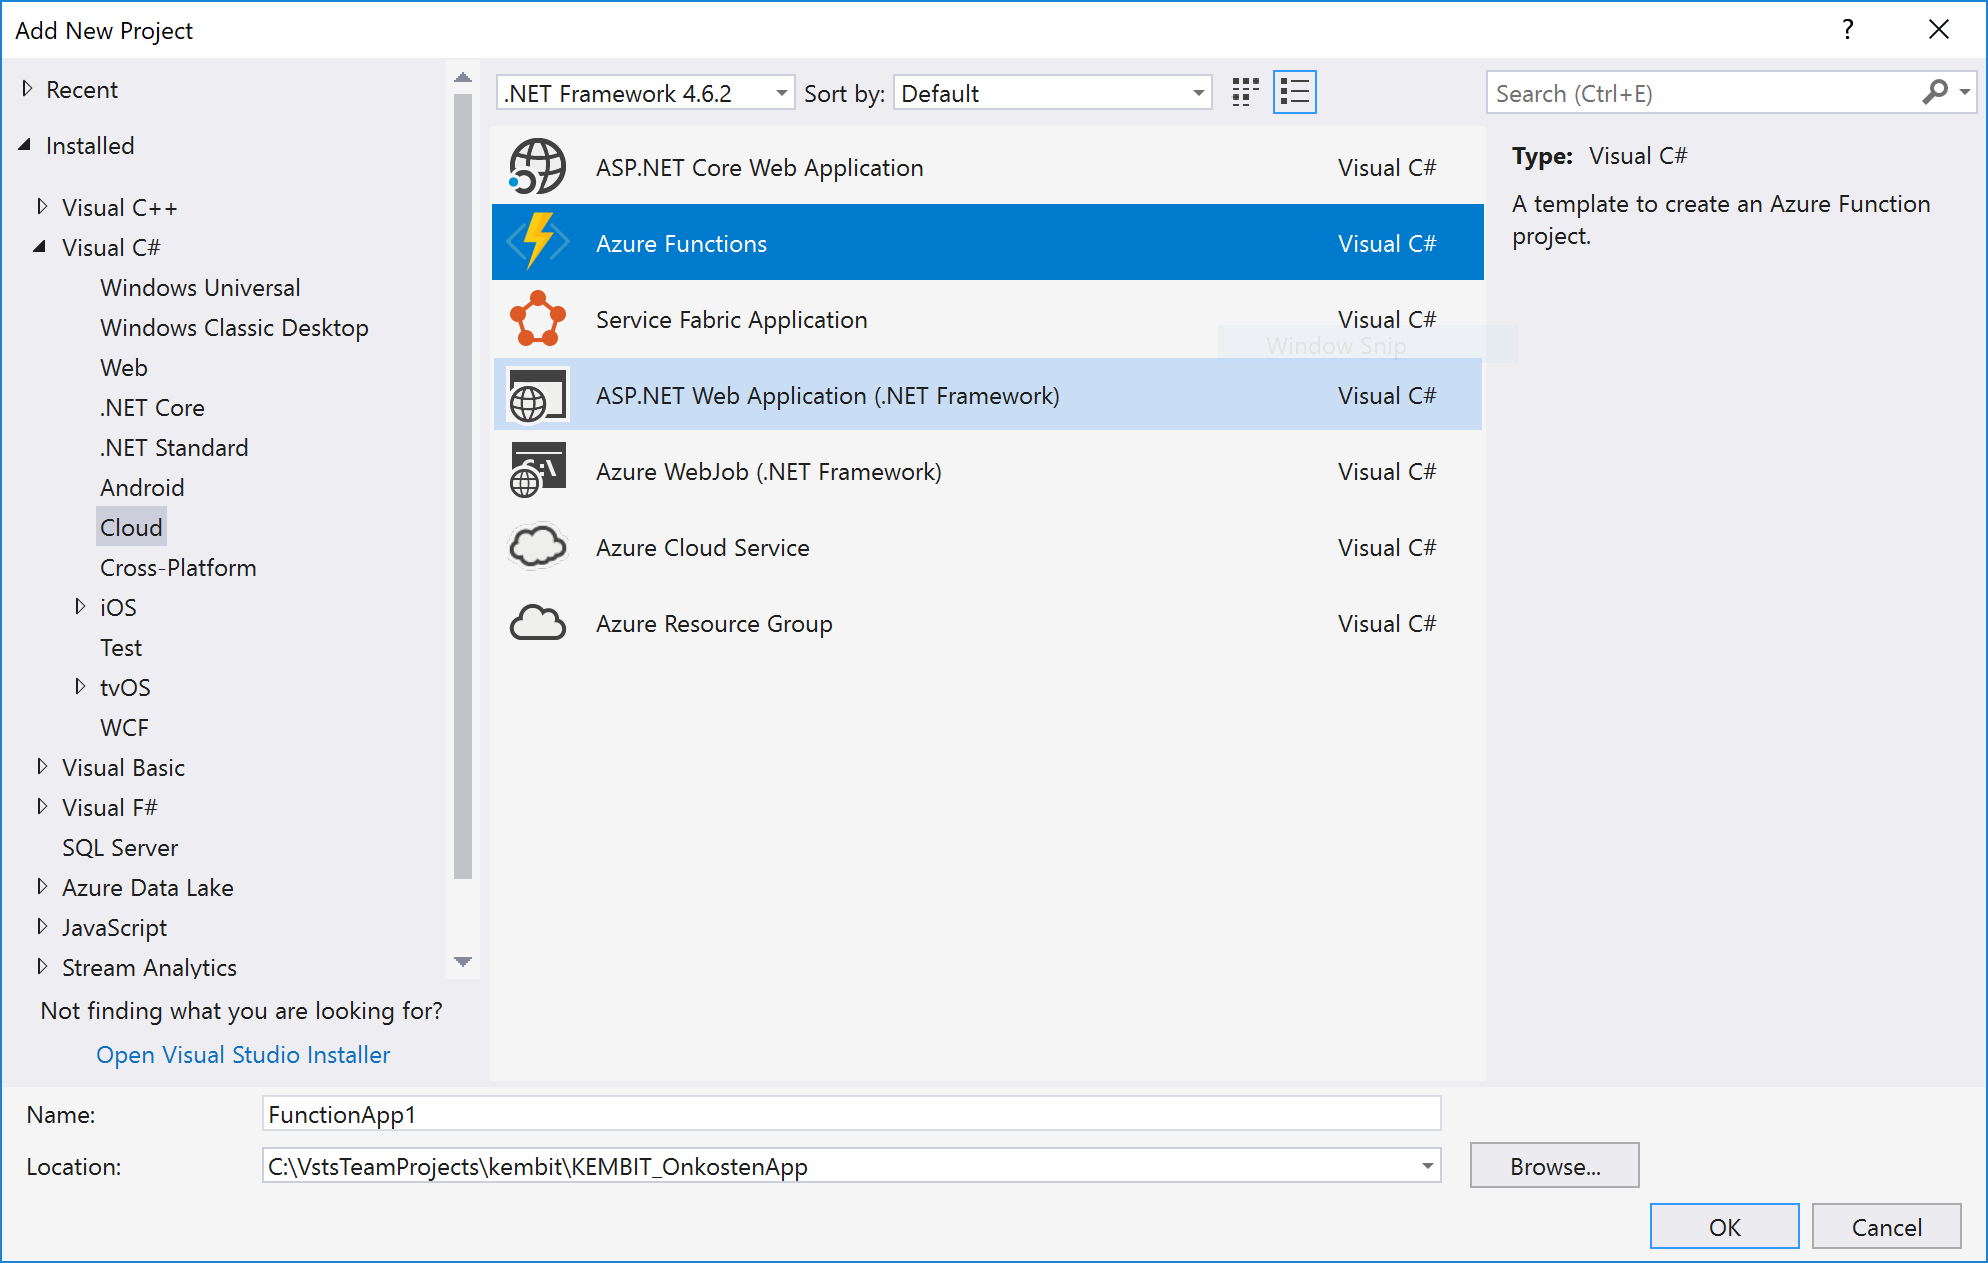
We start by creating an Azure Functions project in Visual Studio. You need to make sure you have the latest updates installed for VS2017 so that these templates are available to you. From here we create an Azure Function that’s triggered by a timer.
This is our main entry point for our bot and it will be running every 5 minutes. To ensure it runs every 5 minutes you need to make sure that you have your CRON expression defined correctly. This is the set of asterisks and numbers at the top of the function. To learn more about CRON expressions you can check out this link. We set it to trigger every 5 minutes at the 2nd second of that minute. This minor delay is to ensure that the exchange has its 5 minute candle data up-to-date.
Wait what? 5 minute candle data?
Let’s elaborate on that for a bit. Cryptocurrency is traded on a number of different exchanges and most of these have some sort of API we can hook our bot up to. This API allows you to query the going rates for cryptocurrencies but also the historic rates which are represented as candlesticks. A candlestick is an object that contains the high, low, open and close of a cryptocurrency over a set time period. This is the data we will be using to analyse trends and decide whether or not it is a good time to buy or sell.
The exchange we will use for this project is called Bittrex. Their API is well documented and simple to use. Other people already made C# libraries for it which makes it easy to include into our little project.
The main trading loop
Our bot runs every 5 minutes and in that timeframe it needs to perform a specific set of tasks. These are the main tasks it should do:
- Check if we have available trade slots within our bot (we want to be able to do multiple concurrent trades).
- Analyse trends and check for buy signals if we have slots available.
- Buy coins when a buy signal is found.
- Check our current trades to see if they match our sell conditions.
- Sell coins when the sell conditions are met.
Our main trading loop looks something like this:
This shows the 5 steps I mentioned above. The actual solution has a lot more stuff going on such as saving the trades to the database and keeping a balance. I omitted those parts for now to simply illustrate how our main loop functions. In this post I will only show portions of the bot to illustrate the principles behind it. The complete code for this project is available on Github.
Indicators
The most interesting and difficult part of a trading bot is the strategy it uses to decide whether to sell or buy. It can process raw data faster than a human ever will but can’t quite interpret real world sentiments such as news (yet). Therefore we need to be able to decide our buy/sell signals based on technical analysis of historic data. Luckily there’s a vast number of technical indicators we can use for that. A library that has all these indicators is called TA-Lib and there are C# libraries available for it!
Our API calls always return a list of Candle objects and it would be great if we could apply technical indicators to those simply by using an extension method. That’s why I wrote some extension methods for a few of the most popular indicators. One of the more popular ones (the Simple Moving Average) looks like this:
Strategies
With our indicators taken care of we can start combining these to create strategies. You can combine as many indicators as you like to form strategies. Each strategy is implemented using an interface called ITradingStrategy which forces you to return a list of integer values for each Candle object you feed into it. These integer values can be one of 3 values:
-1- This is a sell signal.1- This is a buy signal.0- This is the signal to do absolutely nothing.
If we feed our strategy a list of e.g. 100 candles the strategy decides for each of these 100 candles if it contains a sell/buy signal based on the historic data of the previous candles. When running our bot we only have to look at the last item in the list to see what we should be doing. A simple strategy using a SMA crossover looks like this:
In this strategy we create 2 Simple Moving Averages with different period variables. When these two lines crossover it is either a buy or a sell signal depending on which line crosses which. There are thousands of readily available strategies out there on the web using all sorts of indicators. To use them in your bot simply implement a class using ITradingStrategy and tell the bot to use that strategy.
When to sell?
Determining when to sell is almost as hard as determining when to buy. We can use our strategy and wait until it tells us to sell but trades could go on for a long time if we do it that way. We can add some additional checks to sell of our trades quicker:
- Stop-loss percentage - Adding a stop-loss percentage means we sell our trade when it dips below a specific profit percentage. E.g. sell when we have a profit of -3%.
- Rate of interest - We can add support for ROI. This means that we can set stuff like “If we have a profit percentage of 3% after 10 minutes sell our trade immediately”. We could also add support for multiple ROI items so we can stack them.
By adding these two variables our ShouldSell method could look something like this:
Backtesting
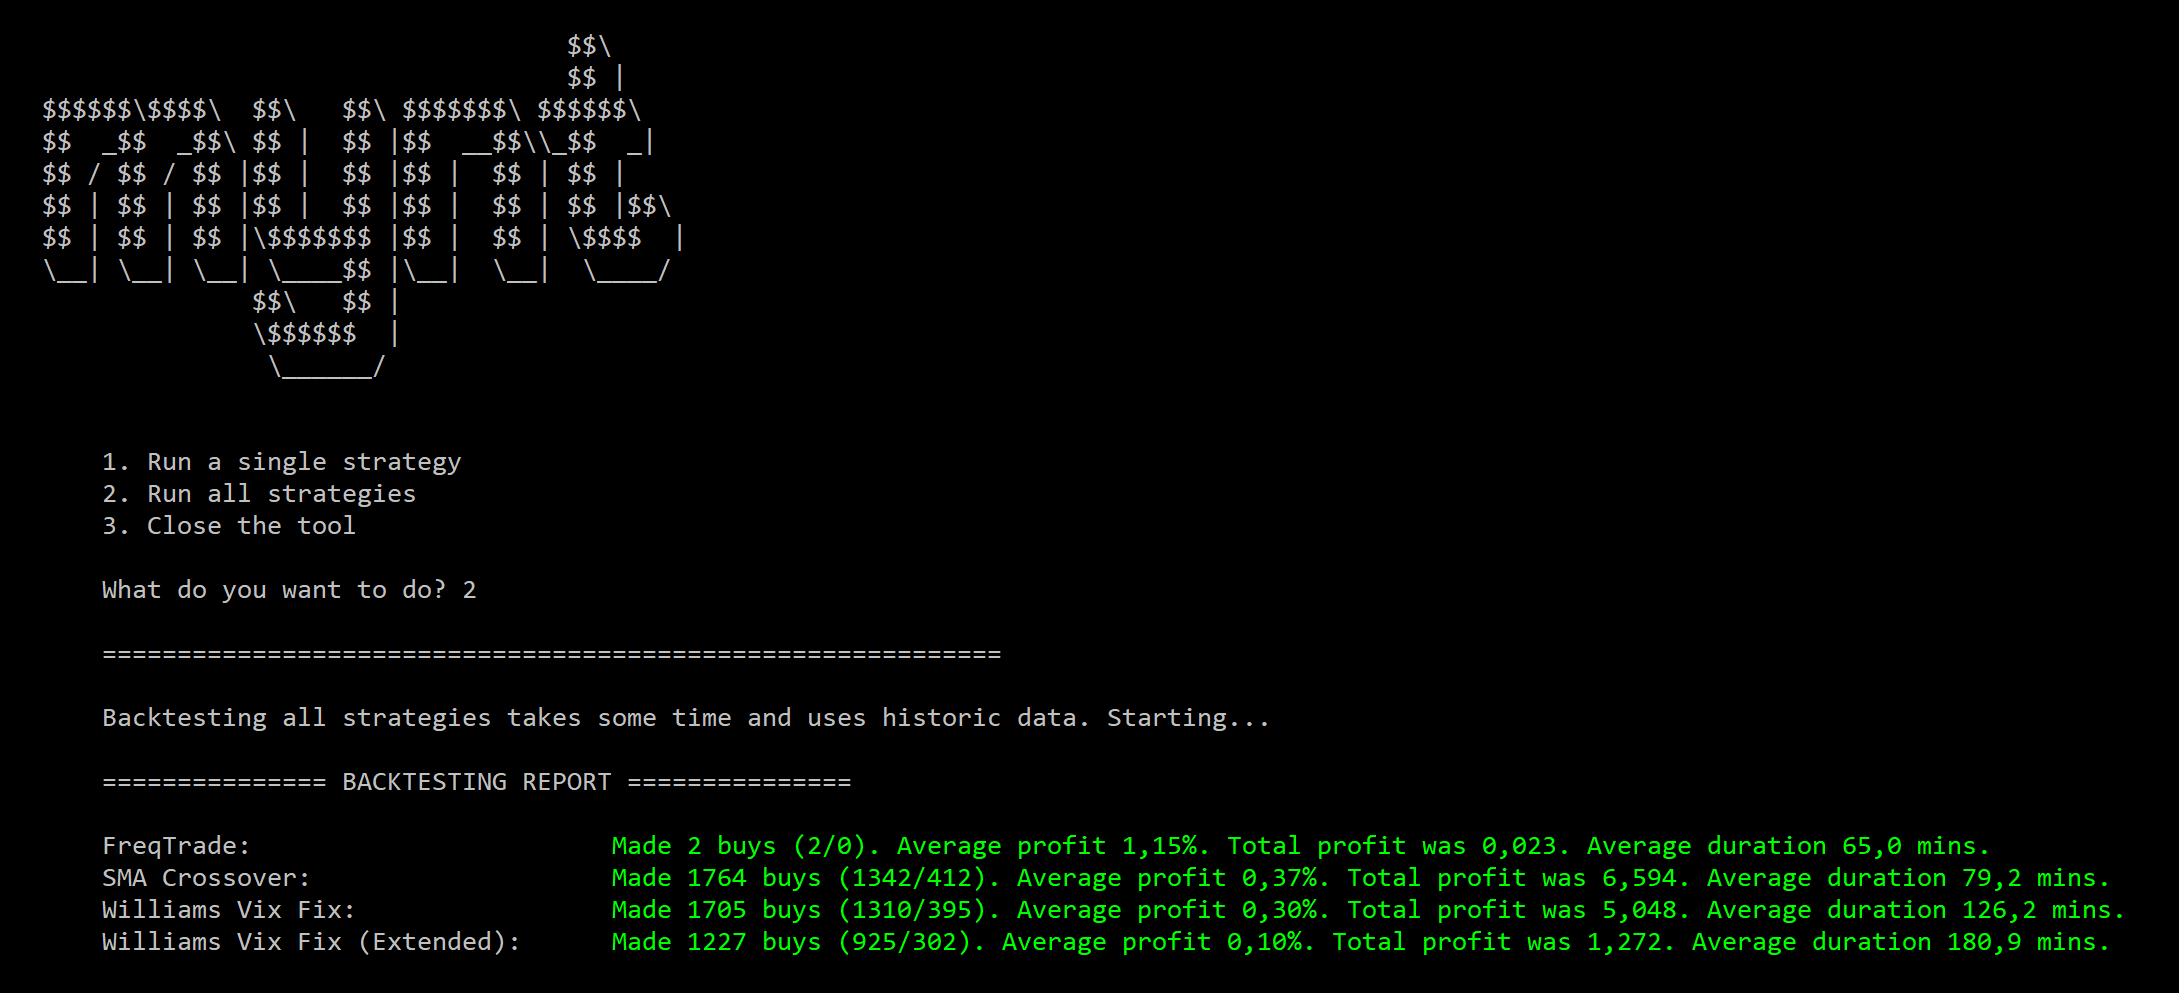
When the amount of strategies you implement grows you want to be able to compare them. We obviously want to improve our strategy to find the best one possible. To support comparing strategies this project also contains a console application that can be used to backtest your strategies. Backtesting uses historic data to compare the performance of all the strategies on the same set of data.
The backtester uses the 5 minute candle data for 10 popular crypto currencies. This data is distributed over a 20 day period and was gathered using the public Bittrex API. If you want to add more data or want to backtest using additional currencies you can use this API to retrieve it.
This console application contains a few of the same variables (such as stop-loss percentage, rate of interest) as the Azure Function that handles trading so you can also tweak these to change the results of your backtest.
Conclusion
All of the parts mentioned above make up a simple trading bot that uses an Azure Function that triggers on a 5 minute schedule. It uses one simple function to perform all the tasks it needs to do every time it runs and can be completely customised using your own custom strategies. You can also implement additional indicators if need be.
If you want to contribute new strategies or additional indicators you can do so by simply submitting a PR to the Github repo. That way the existing bot can be continuously improved and we can share our strategies.
In the next post in this series we will hook up a Xamarin mobile app which enables us to monitor our active trades. We will also add additional functionality to directly sell off a trade from within our mobile app.
The bot can be found on Github at https://github.com/sthewissen/Mynt.


